Accuracy testing of the PhosphorFAX radiofax receiver against synthetic charts and real over-the-air recordings of US Coast Guard weather fax broadcasts. The test tool runs exactly the same decoder and encoder code as the app — same code, same output. Results below are from the current build.
A 1809 × 1300 chart encoded by the app's own transmitter, then decoded. Offset and skew are measured against the original chart row by row; skew is the drift across all 1300 lines.
| Case | Measured LPM | Slant ppm | Offset px | Skew px | End |
|---|---|---|---|---|---|
| Clean, 120 LPM | 120.000 | 0.0 | 0.0 | 0.0 | STOP TONE |
| Clock +200 ppm | 119.976 | +200.0 | −1.0 | 0.0 | STOP TONE |
| Clock −200 ppm | 120.024 | −200.0 | −0.1 | −0.1 | STOP TONE |
| Clock +500 ppm | 119.940 | +500.0 | −0.5 | −0.1 | STOP TONE |
| Tuned 20 Hz off | 120.000 | 0.0 | +0.1 | 0.0 | STOP TONE |
| 60 LPM | 60.000 | 0.0 | 0.0 | 0.0 | STOP TONE |
| 90 LPM | 90.000 | −0.3 | −0.1 | +0.5 | STOP TONE |
| 180 LPM | 180.000 | +0.7 | −2.2 | −1.5 | STOP TONE |
| 240 LPM | 240.000 | 0.0 | −0.2 | −0.1 | STOP TONE |
| 850 Hz shift (DWD) | 120.000 | 0.0 | 0.0 | 0.0 | STOP TONE |
| Noise σ 0.2 (about 6 dB SNR), five runs | 120.000 | −30 to +13 | −16 to +22 | 1 to 44 | STOP TONE |
| Noise σ 0.3, clock +150 ppm | 119.981 | +156.4 | −8.2 | −15.0 | STOP TONE |
| Noise σ 0.5 (about −2 dB SNR) | — | — | — | — | STOP TONE, NO PHASE |
Under heavy noise the chart is still received, but the slant taken from phasing varies from run to run. RE-SLANT in the chart viewer straightens it afterwards from the stored signal.
The test card sent by PhosphorFAX's own transmitter in every format it offers, then received by PhosphorFAX. Each format was sent as 8 kHz audio, as a WAV export, and as 48 kHz audio, as the iPhone plays it through its speaker. A pass means the chart started on its start tone, stopped on its stop tone, and came out at the right IOC and line rate within 2 pixels of the original.
| IOC | 60 LPM | 90 LPM | 100 LPM | 120 LPM | 180 LPM | 240 LPM |
|---|---|---|---|---|---|---|
| 576 | PASS | PASS | PASS | PASS | PASS | PASS |
| 288 | PASS | PASS | PASS | PASS | PASS | PASS |
| Option | Result |
|---|---|
| 850 Hz shift, IOC 576 and 288 | PASS, within 4 pixels |
| 60 phasing lines | PASS |
Publicly available recordings of live broadcasts, decoded at the app's default settings. These are over-the-air captures — no cleanup, no SNR preconditioning.
| Recording | Duration | Result |
|---|---|---|
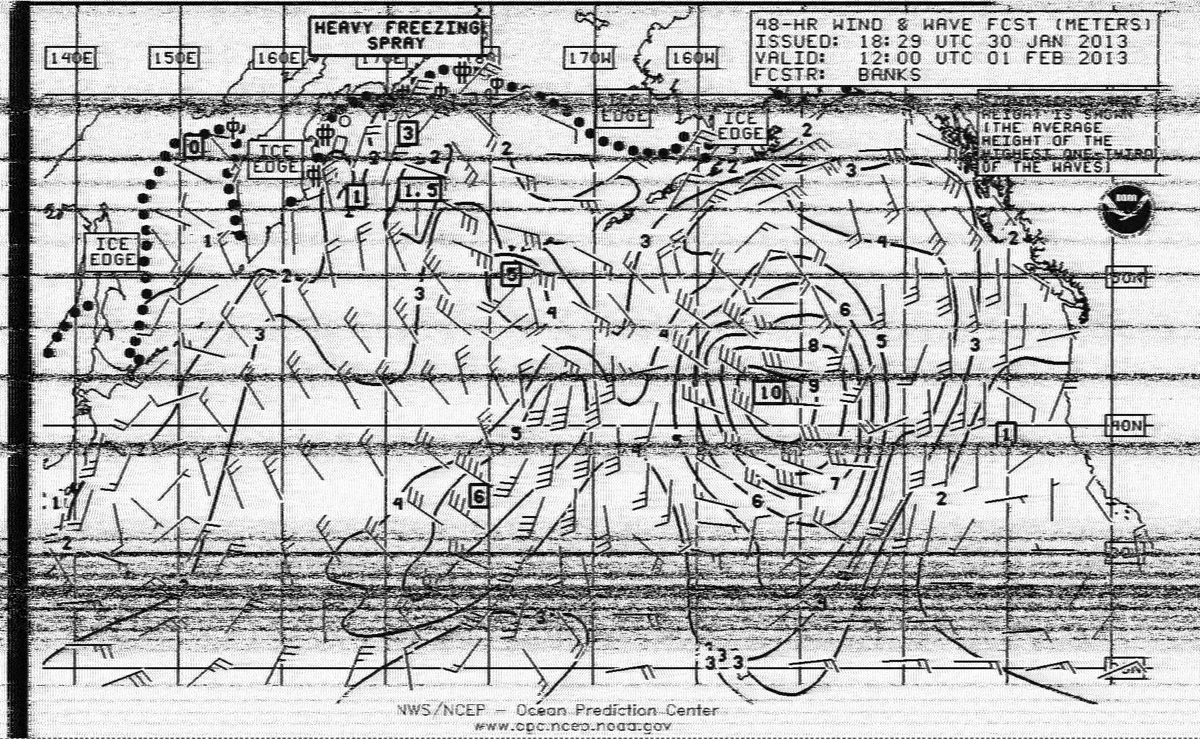
| NMC Point Reyes, 17151.2 kHz, 30 Jan 2013 — OPC 48-hour wind and wave forecast (source) | 9 min 57 s | Start tone to stop tone, 1114 lines, 120.001 LPM, −8.2 ppm |
| US Coast Guard New Orleans, 8502 kHz dial, 14 Mar 2013 — NHC 24-hour surface forecast (source) | 9 min 29 s | Joined mid-phasing, locked, 1092 lines, 120.005 LPM, −41.9 ppm |
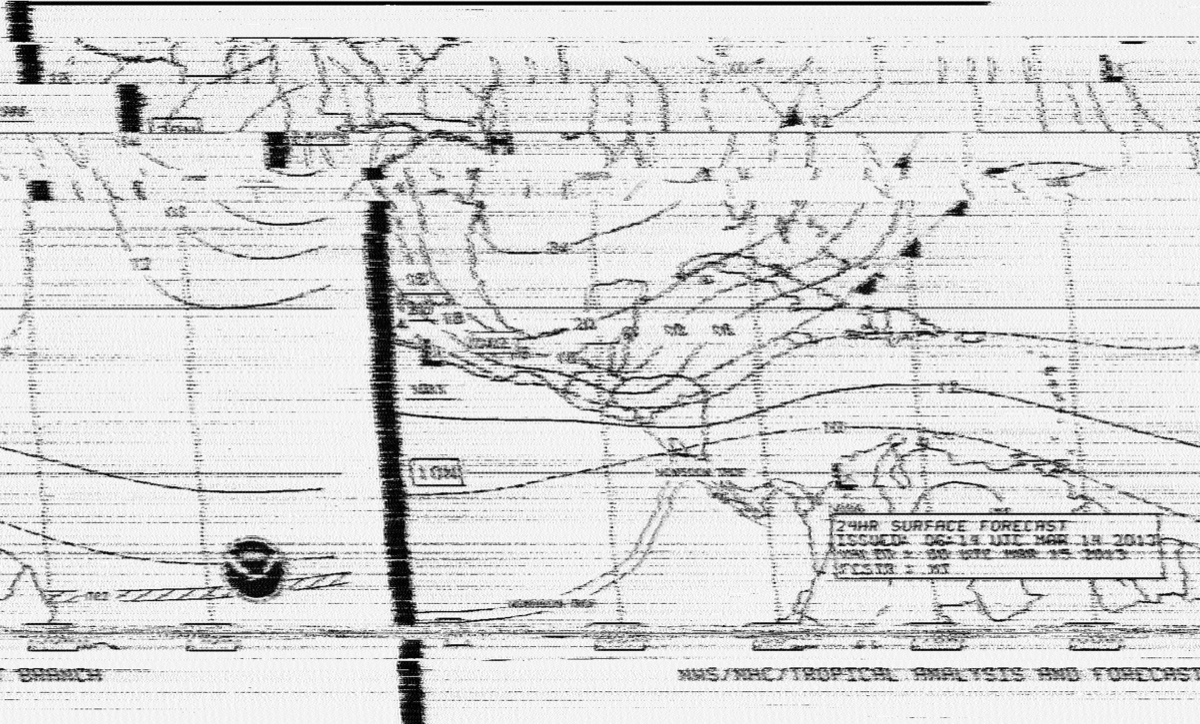
The recording begins partway through the phasing signal, so no start tone was heard. The receiver locked on phasing alone.
A test card encoded by PhosphorFAX's own transmitter: start tone, 20 phasing lines, 300 image lines at IOC 576, 120 LPM, stop tone. Play it from any audio source near the iPhone's microphone to test the app without a shortwave receiver.
| File | Description | Size |
|---|---|---|
| phosphorfax_test_card.wav | 3 min 2 s — test card, 302 lines expected | ~3 MB |
Expected result:

The real recordings above can be played the same way from their sources.